About the User Interface
The MoveIt Pro user interface is composed of configurable view panes that provide different perspectives on your robot's state and environment.
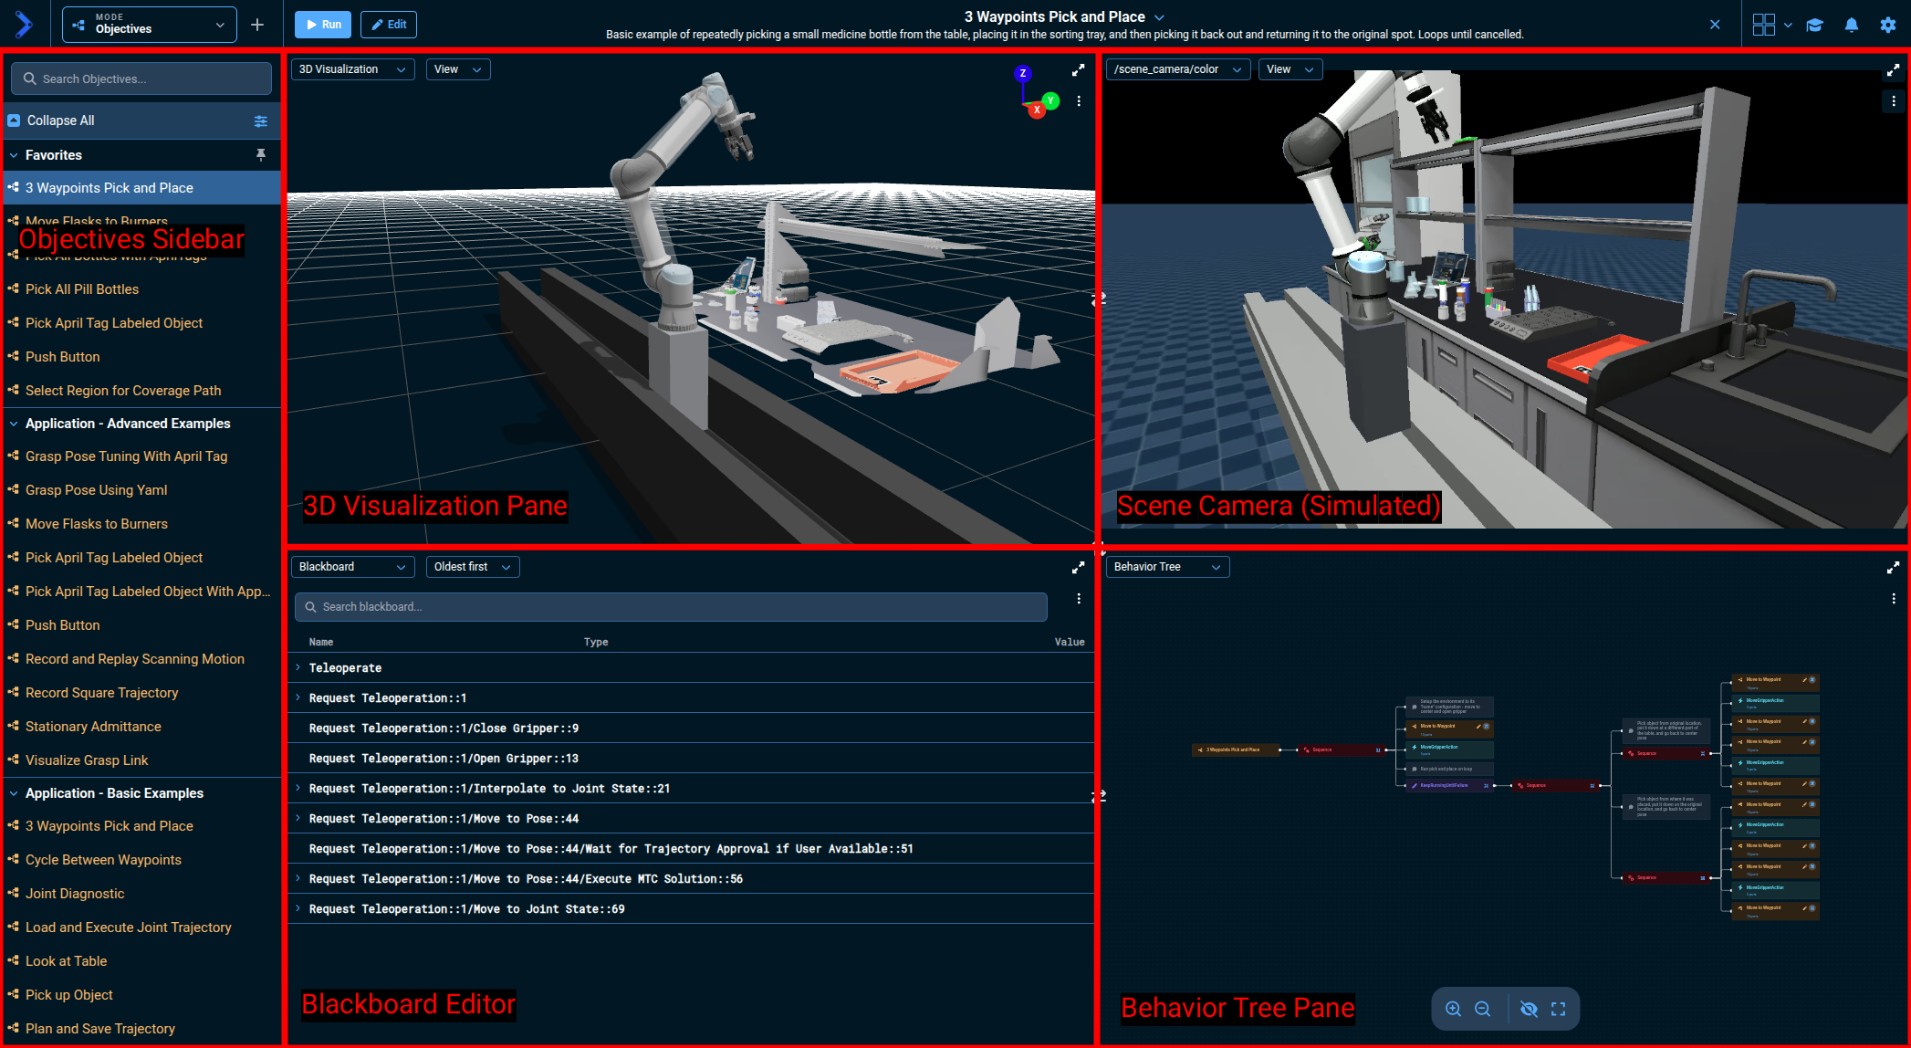
Customizing the Panes
You can change which content is displayed in each pane using its dropdown menu, and adjust the number of panes under Layout in the View section of Settings. View pane controls are visible by default. To hide the controls until the pane is hovered or focused, open Settings from the top navigation bar and turn on Hide view pane controls until hovered or focused under Preferences.
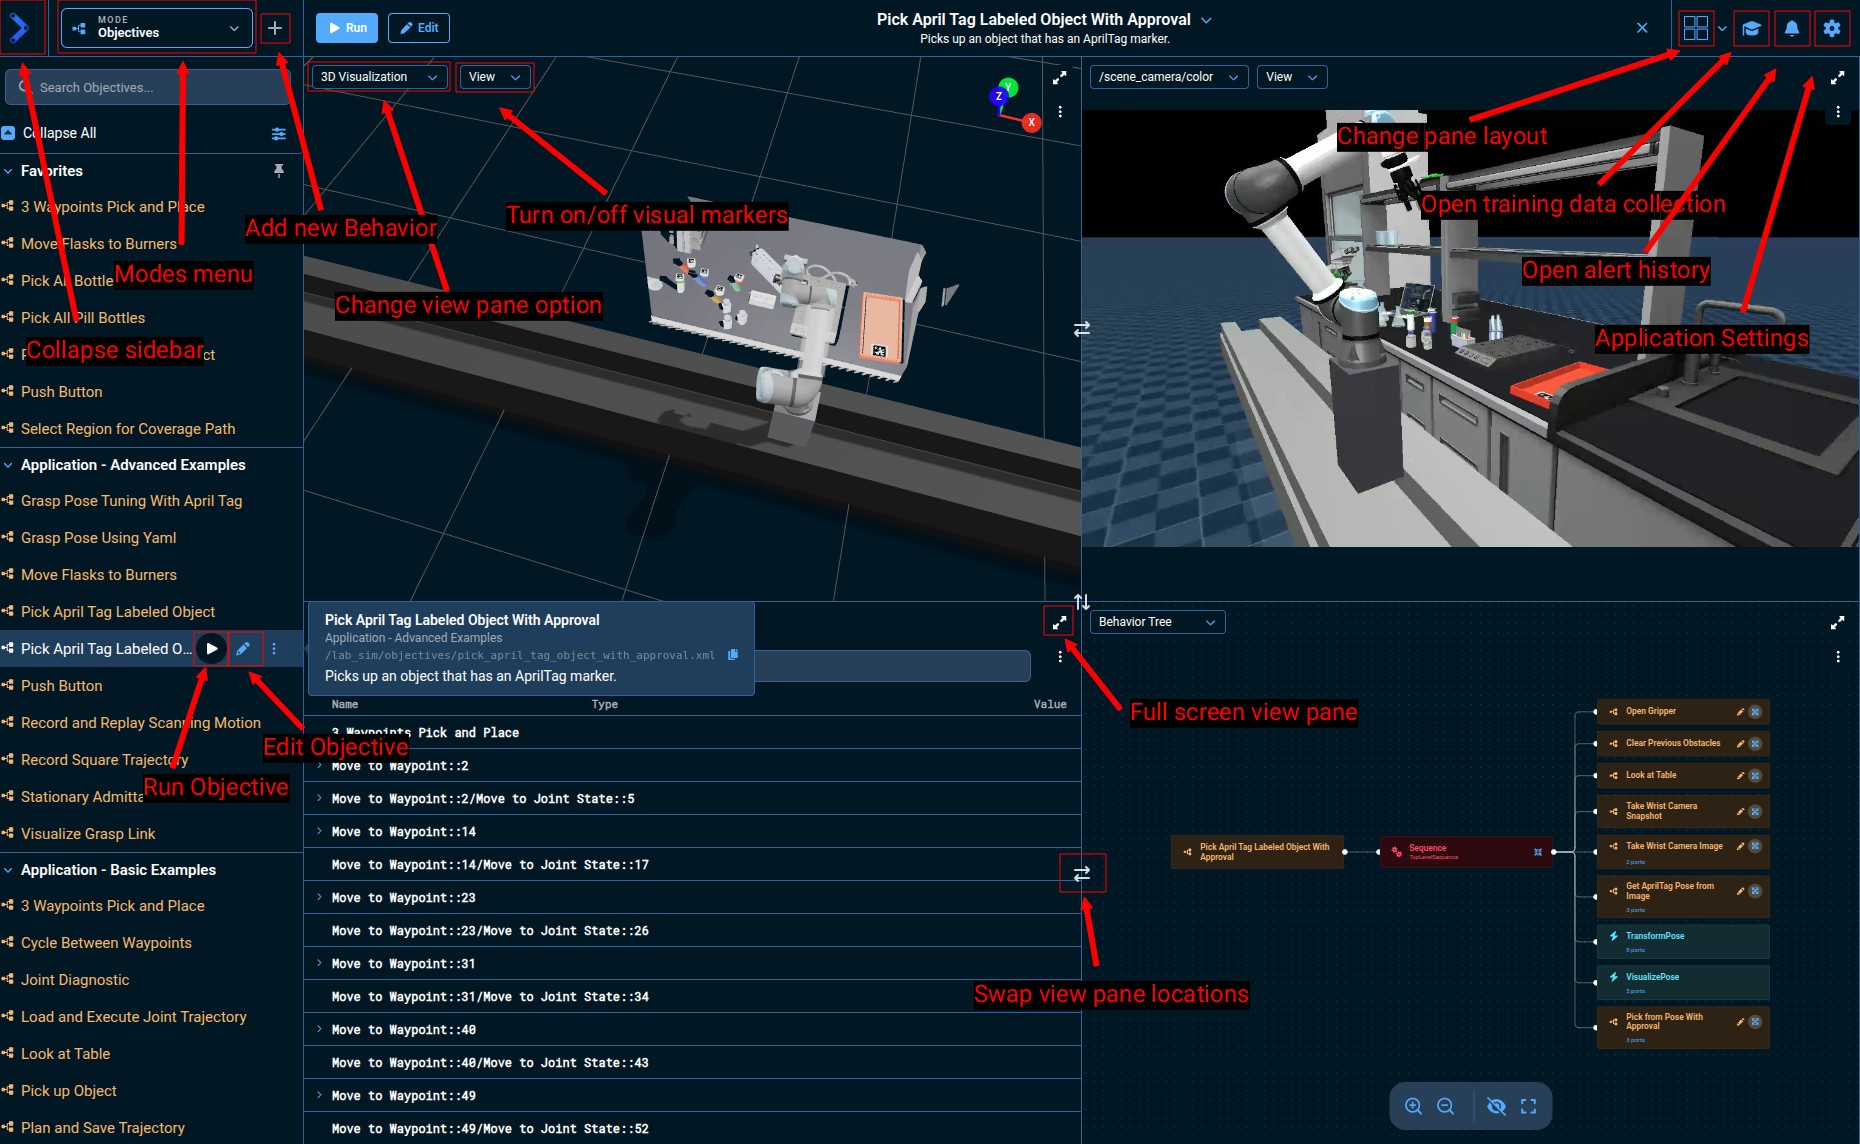
Canvas Layout
To change the number of visible panes, open Settings from the top navigation bar and pick a layout under View > Layout. You can choose from several layout options, including 1 through 6 pane configurations. Right-click a view pane for layouts beyond the presets.
Save and Load View Configurations
Switch between named viewer setups from Configuration, beside Fixed Frame in the 3D Visualizer pane's View menu. Arrange the panes, select camera feeds or custom panes, and configure the 3D Visualizer. Select Save Current View, enter a name, and select Save. To switch, select a configuration's name in the Configuration submenu; the submenu shows the configuration this window last loaded or saved, and Update replaces that snapshot with the current viewer. Manage Configurations marks the configuration this window last loaded or saved as Active and offers Load for other snapshots, plus update and delete actions. To reload the active snapshot after viewer edits, select its checked name in the Configuration submenu. Deleting does not change the viewer.
A view configuration saves pane choices and split sizes, the fixed frame, top-level display switches, TF frame visibility and label settings, and per-link visual/collision visibility. To hide walls or rails while inspecting trajectories, expand Robot - Visual or Robot - Collision in the 3D Visualizer sidebar and clear the corresponding link checkboxes. These switches hide geometry only: child links, transforms, and collision checking remain unchanged.
Loading replaces the current viewer settings. Save edits before switching; changes do not automatically update a named snapshot. Camera viewpoints, sensor appearance settings, robot state, and application preferences are not included. Terminal panes restore through their normal session lifecycle; snapshots store pane choices, not terminal contents, session IDs, or commands. Host and AI Assistant require host shell access on the connected Runtime; otherwise their panes show how to enable it. Opening AI Assistant from a saved layout starts the configured agent just as selecting that pane does. Custom panes must already be configured on the Runtime; snapshots reference their names and do not copy URLs or ROS permissions. Unavailable camera feeds keep their saved topic choices, and a removed custom pane leaves an empty pane that can be configured again.
Snapshots are shared through the active robot configuration package's frontend_settings.yaml. See Configure Frontend Settings for persistence and deployment details.
Changing a View Pane
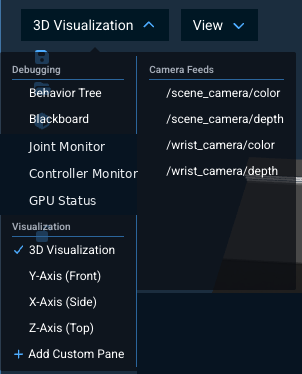
To change the content displayed in any pane, click its dropdown menu in the top left. A list of available views will appear, including camera feeds, the 3D Visualization, Behavior Tree, Blackboard, Joint Monitor, GPU Status, and more. Select the desired view to switch that pane's content.
3D Visualization Pane
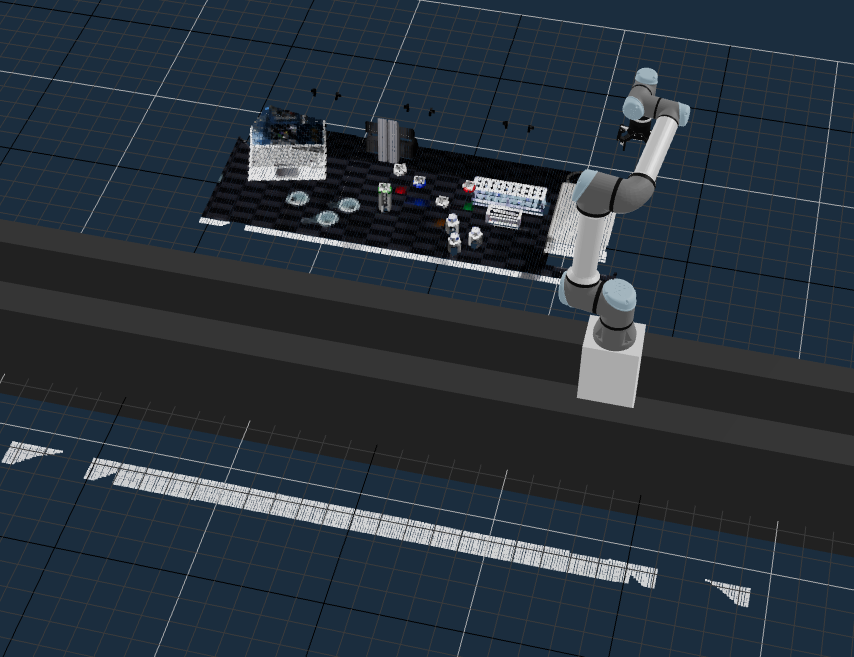
Displays a rendering of what the robot understands of the world, similar to the common RViz visualizer in ROS. In MoveIt Pro this understanding of the world is stored in a Planning Scene. The Planning Scene is a combination of our robot's URDF model, point clouds, octomaps, meshes, and geometric primitives. These data sources are used to avoid collision with the robot and the world.
The view of the scene can be adjusted by clicking within the pane and dragging the mouse around. The left mouse button rotates the scene, and the right mouse button drags the scene.
Orthographic View Modes
In addition to the default 3D perspective view, MoveIt Pro provides three orthographic views along the X, Y, and Z axes. These allow you to view the robot and scene from multiple perspectives simultaneously, which is useful for precise alignment and debugging.
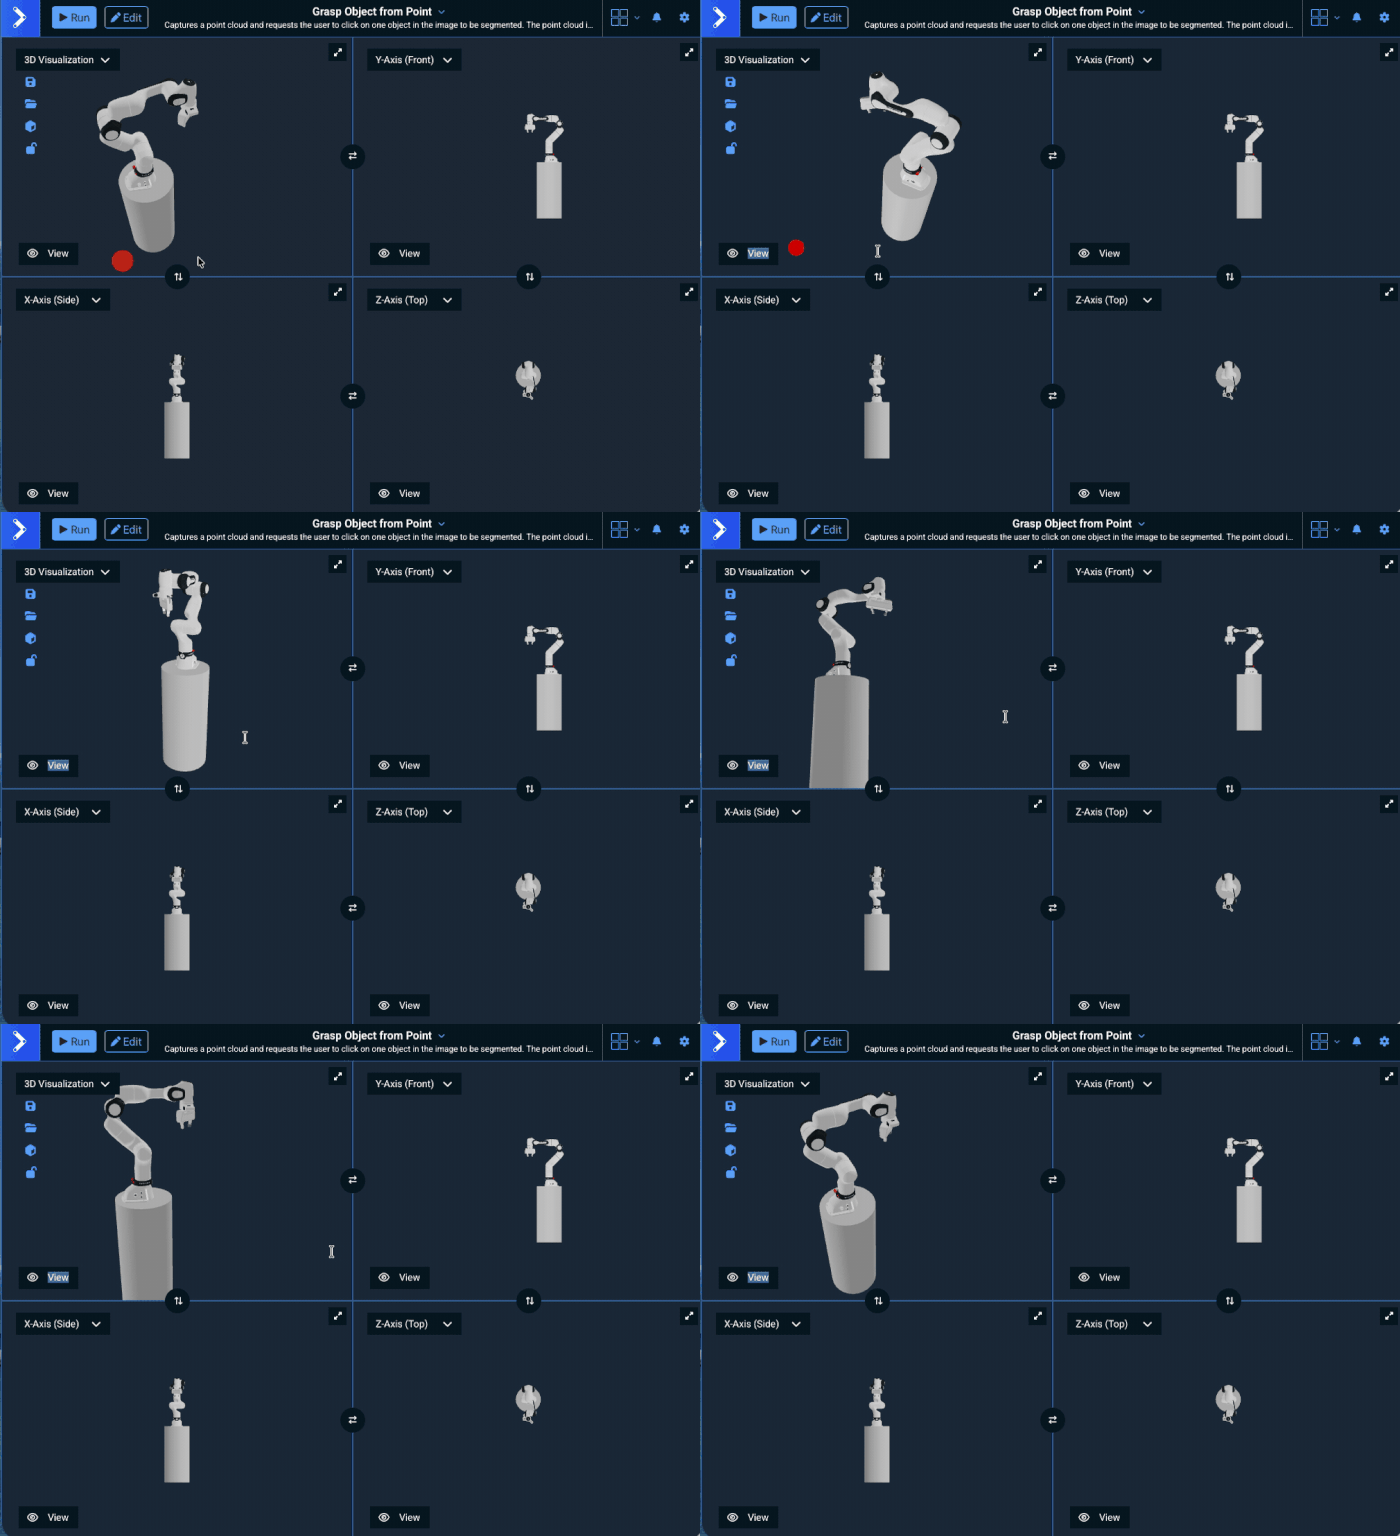
The different views can be selected from the view dropdown menu in any pane.
Fixed Frame
The Fixed Frame submenu of the 3D Visualizer pane's View menu chooses which TF frame the scene is rendered relative to, similar to RViz's Fixed Frame control. The submenu row shows the active frame; open it to filter and pick a different one. The default comes from the referenceFrame frontend setting (usually world); picking a different frame applies for the current session and resets on reload.
Measuring and Reading Coordinates
Turn on Measure distance and coordinates under Controls in the 3D Visualizer pane's View menu to read positions out of the scene. Move the cursor over the robot, a collision object, or a point cloud: the point under the cursor is marked, its position is labeled beside it, and the readout box at the bottom left reports the same position in the active fixed frame. The cursor snaps to the point a cloud actually holds, so the numbers are the sensor data rather than a spot near it. Use this to find where a coordinate sits before setting one, for example when tuning the limits of a crop box.
Click to place a point and keep measuring: each segment reports its length and the readout shows the running total along with the last segment's per-axis deltas. Esc removes the last point, or leaves the tool once none are left. Enter ends point placement and keeps the finished measurement on screen; turn the tool off and on to read more coordinates.
Point clouds answer the cursor only while the tool is placing points, so dense clouds cost nothing to display the rest of the time. Off geometry the tool projects onto a plane instead of reading a position, and marks that reading (in space). Coordinates are read in the active Fixed Frame; selecting another one clears the current measurement, because the scene re-roots around the points already placed.
Displaying TF Frames
Open the View menu in the top left of the 3D Visualizer pane, then open Display and enable Transforms. This overlays live TF coordinate frames on the scene as RGB axes, similar to RViz's TF display — handy for checking a frame's pose (such as the robot's tip frame) without opening RViz. See Visualize TF Frames for details.
Camera Frusta
Enable Camera Frusta in the 3D Visualizer sidebar to show camera images on planes in the scene. The settings icon beside View → Camera Frusta opens this section. Expand a camera row to hide it, change Image Plane Distance (m), or inspect its automatically associated Camera Info Topic. These controls follow the same per-source organization as Sensor Streaming. Changing the plane distance changes the display size without changing the camera pose or field of view. Turning an individual camera off and back on restores its default frustum settings.
Orbit and zoom normally: images stay anchored to their cameras, robot-mounted cameras follow the displayed robot, and nearer scene objects occlude the images. The frusta use the Runtime's CameraInfo and TF rather than inferring camera poses from names. They switch between live video and recording playback along with the camera panes.
Use rectified images with matching CameraInfo. Calibration is associated using standard camera-local topic names, including image-transport suffixes and shared color/RGB/depth namespaces. The association is read-only; missing or ambiguous matches leave the frustum hidden. A small gray note below the topic explains association, calibration, transform, or stream problems. After moving a simulated camera with Enable Camera Moving, reset it from its camera pane before displaying its frustum.
Camera Feeds
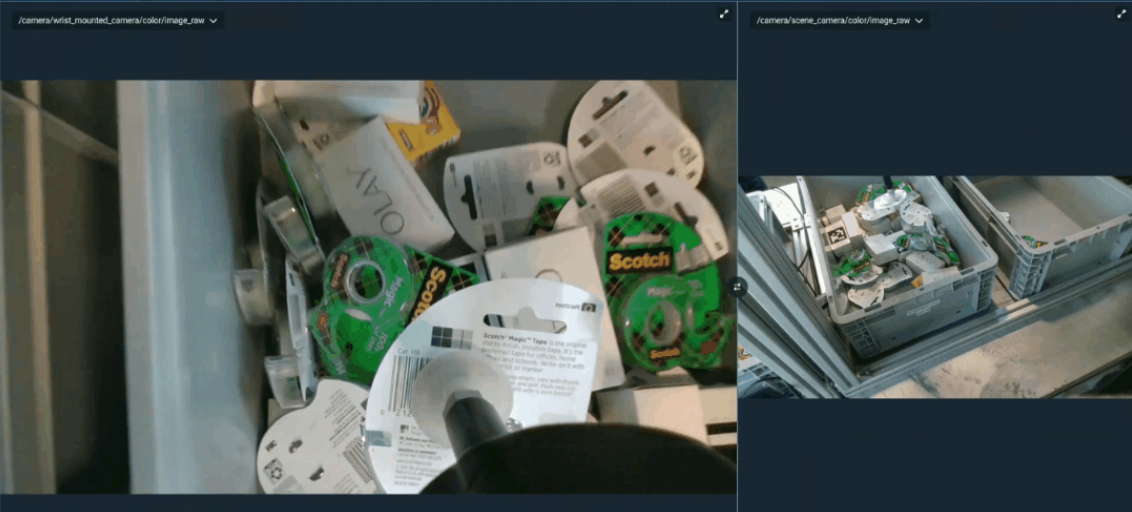
The /scene_camera/color, /scene_camera/depth, /wrist_camera/color, and /wrist_camera/depth panes show the camera feeds from the underlying simulator. If you were connected to hardware, these cameras would show the real world and not simulations.
Checking Camera Calibration
Open a rectified camera feed, then enable View → Show 3D Overlay. Set 3D Overlay Camera Info Topic to the matching sensor_msgs/msg/CameraInfo topic; the initial value follows the sibling camera_info naming convention. The overlay projects the robot model, planning scene, markers, and enabled point clouds into the image using the camera's calibration and optical-frame TF.
Adjust Image Opacity to compare the image with the 3D geometry: 0% shows geometry over the image background, and 100% shows only the image. Use the 3D Visualizer's display controls to choose which scene elements appear. The overlay keeps the full image visible when resizing or expanding the pane.
Use a rectified image with a rectified ROI (roi.do_rectify=false). The overlay does not perform raw-image or ROI distortion correction. Keep the robot and scene stationary while checking alignment: video and 3D data arrive independently and are not synchronized to the same capture time. The overlay pauses during recording playback. If you move a simulated camera, disable Enable Camera Moving and select Reset View before checking calibration.
A message in the pane identifies missing or invalid CameraInfo, mismatched image dimensions, or missing optical-frame TF. Correct the named topic or transform to resume the overlay.
Behavior Tree Pane
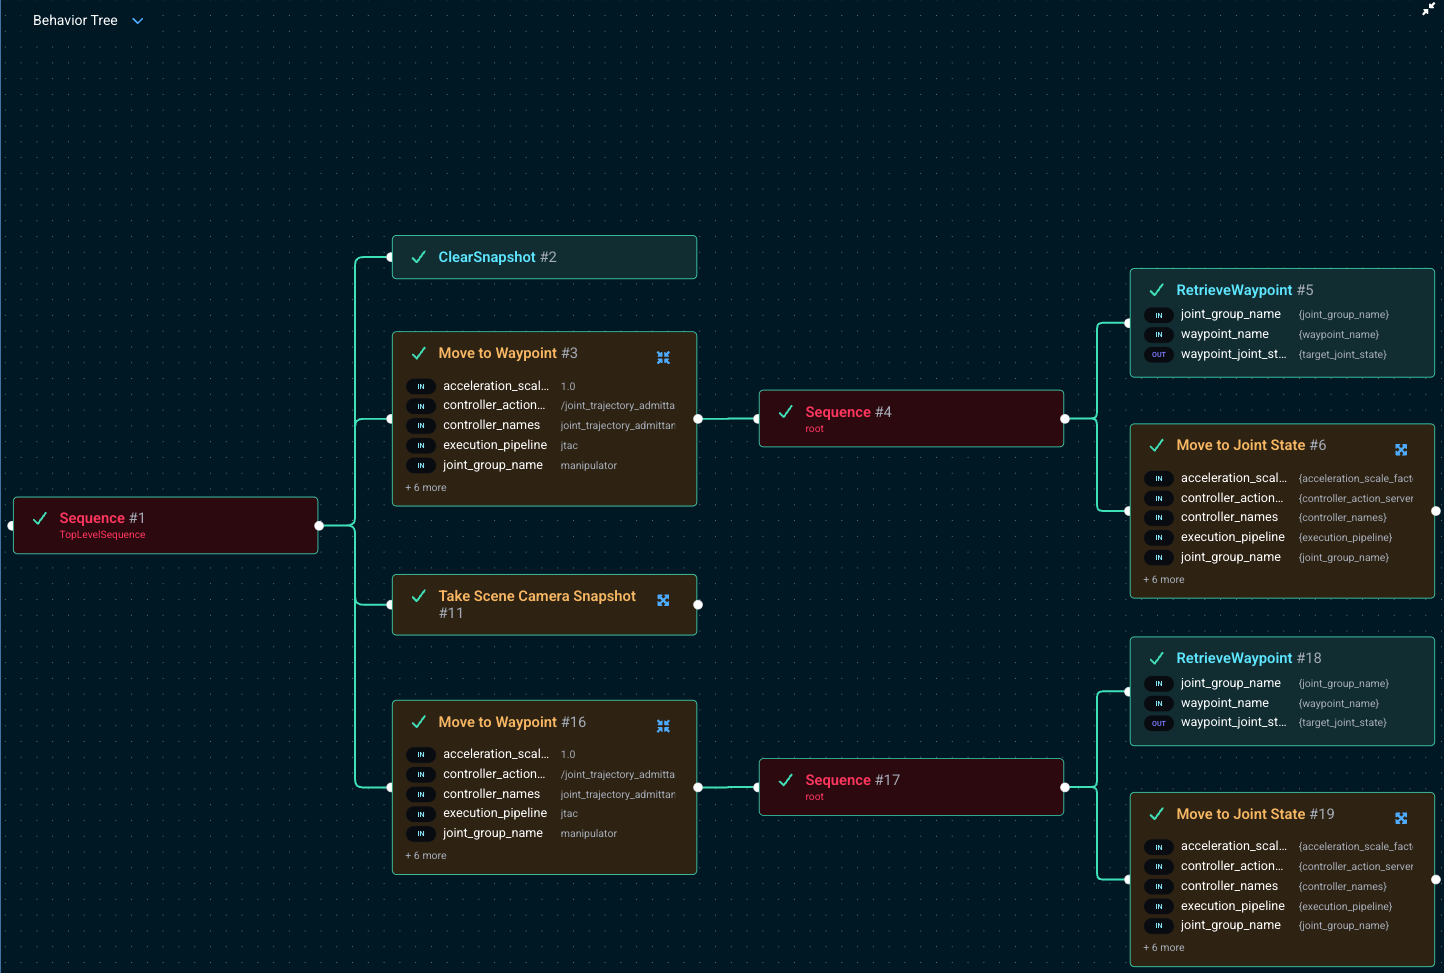
In this pane the most recently run Objective is shown, if any. While running an Objective, this pane will highlight which Behavior is currently executing, which is useful for debugging and introspection.
Blackboard Pane
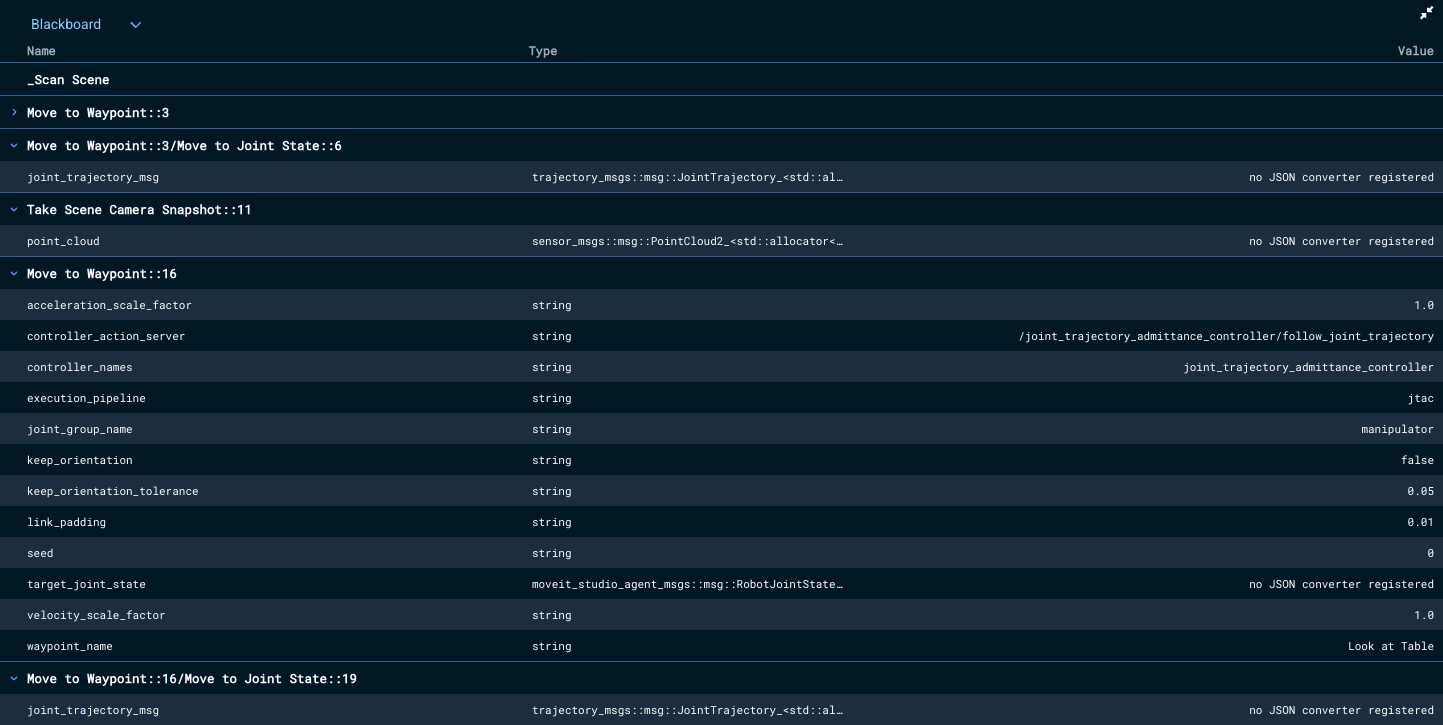
This pane shows the variables being passed around on the Behavior Tree blackboard. These parameters are the key data that is passed around between Behavior nodes.
Terminal Pane
The Terminal pane provides an interactive shell directly in the UI, so you can inspect the running stack — check a ROS topic, tail a log, run ros2 CLI commands, or browse the filesystem — without leaving MoveIt Pro or opening a separate SSH session. It is a full terminal: colors, resizing, and interactive programs such as vim and htop all work.
Open it from any pane's view dropdown under the Terminal (beta) heading, which offers up to two targets:
-
Container — a shell inside the running MoveIt Pro container. Always available, and the right choice for inspecting the ROS 2 environment and workspace.
-
Host — a shell on the host machine. Because commands here run outside the container's sandbox, this target is disabled by default. To enable it, start MoveIt Pro with:
moveit_pro run --allow-host-shellWhen it is not enabled, the Host entry still appears in the dropdown but is disabled, with a tooltip explaining how to enable it.
A status indicator in the toolbar shows the connection state, and Clear resets the screen. Sessions survive a brief network disconnect or a pane switch, so you can keep working without losing shell state.
A program running in the terminal can copy to your clipboard itself; the coding agent does this when you ask it to copy something. To copy manually, select text and press Cmd+C on macOS or Ctrl+C on Linux and Windows. On Linux and Windows, Ctrl+C copies only while something is selected; with an empty selection it still sends the interrupt to the running program. On macOS it never copies — Ctrl+C always reaches the program, because copying is Cmd+C.
While a program that captures the mouse is running, such as htop or a coding agent, dragging is passed to that program instead of selecting — so let the agent copy for you rather than selecting by hand. To select anyway, hold Option on macOS, or Shift on Linux and Windows, before pressing the mouse button. The terminal decides at the moment of the press whether the drag selects or goes to the program, so pressing the modifier once the drag is under way selects nothing.
The Host shell runs with the privileges of the user that launched MoveIt Pro and is outside the container sandbox. Only enable it on machines where that level of access is appropriate.
Joint Monitor Pane
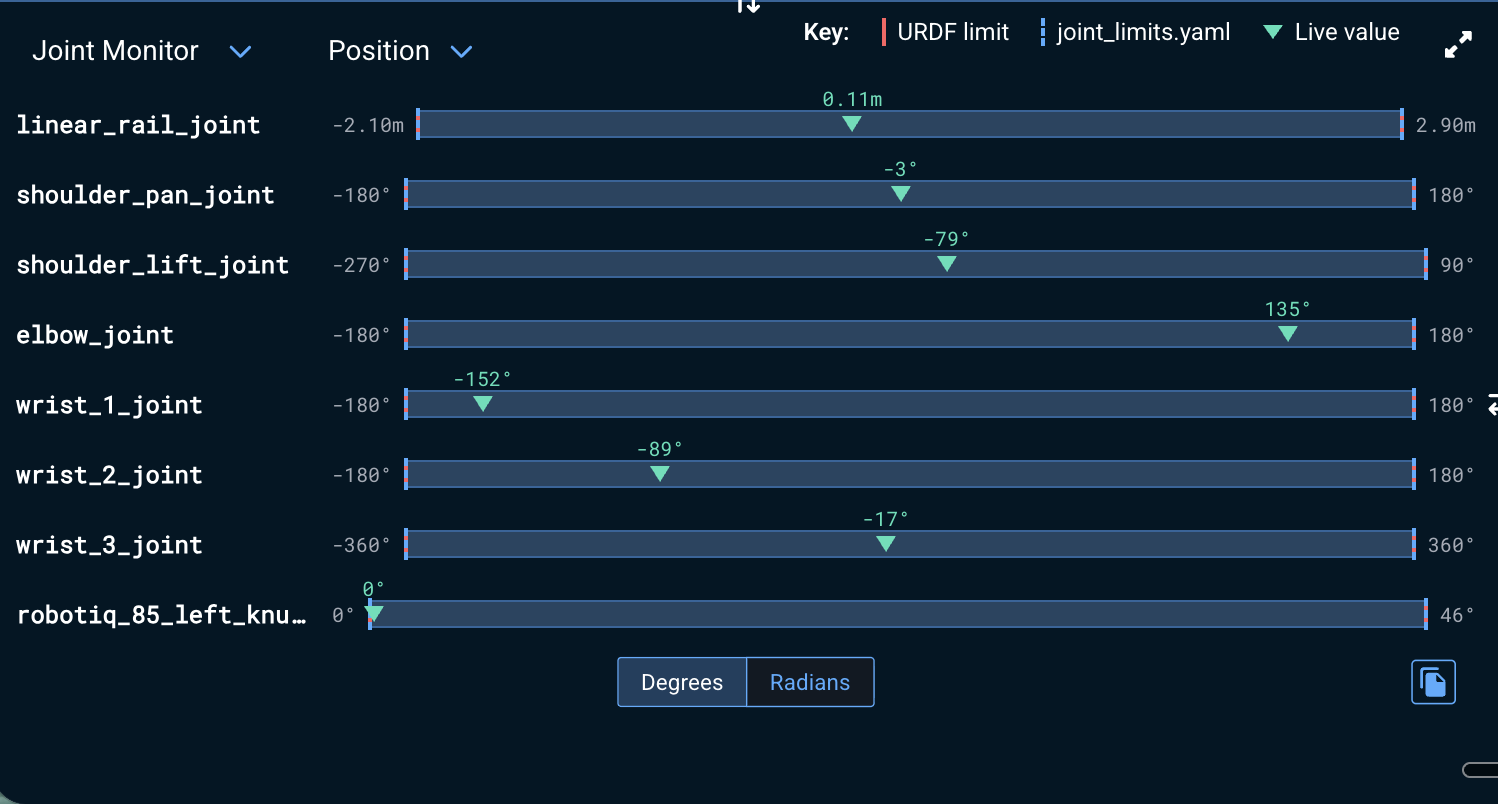
This pane shows, for each active joint, the live value alongside its limits, which is useful for hardware debugging. Use the mode dropdown in the top left of the pane to switch every joint between Position, Velocity, and Acceleration. Each joint shows a horizontal bar with two distinct ticks per bound: the limit declared in the URDF (solid red) and the (often tighter) limit from joint_limits.yaml (dashed). A key at the top explains the marks, and a marker tracks the live value, turning red when it leaves the joint_limits.yaml range. Acceleration is not published on /joint_states, so it is derived by differentiating velocity. A Degrees/Radians toggle controls the units for revolute joints (prismatic joints always read in meters), and a button copies the current joint values to the clipboard. Joints are listed in the order the robot model reports them, which walks the kinematic tree outward from the base, so each limb's joints stay together and in order. A revolute joint with no position limits (such as a continuous wheel joint) gets a ±180° bar with no limit marks, and its reading is wrapped into that range rather than accumulating across full turns; a prismatic joint with no position limits shows its live value on its own line, since there is no meaningful range to draw a bar over.
GPU Status Pane
The GPU Status pane is available under Debugging. It reports observed client visualization and server simulation and ML acceleration separately, so deployment configuration is not mistaken for a live hardware outcome. Runtime observations refresh automatically; use Refresh to request an immediate update. Copy Diagnostic Summary copies the displayed read-only status and device details for support tickets. If an update fails, server capabilities become Unknown and the pane shows the cached payload's age instead of presenting its states as current.
In the Desktop App, Client — This Computer also lists the GPU devices Chromium detected and marks which device is active for Electron rendering. Present-but-inactive adapters are informational and do not override the observed WebGL capability state. ML inference shows Not tested yet until a live model session is observed, and CPU only when all observed sessions use CPU without live accelerator intent.
Custom View Panes
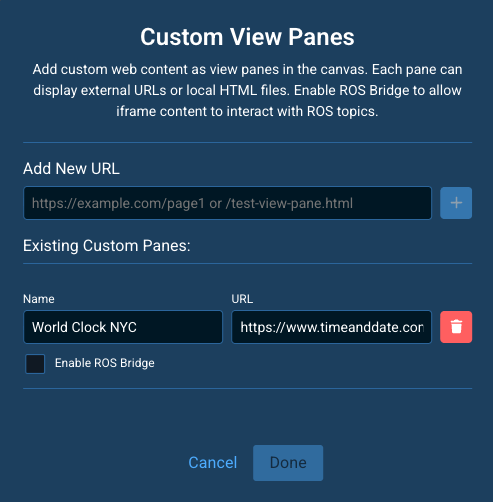
MoveIt Pro also supports embedding custom iframe-based view panes into the UI. This allows you to integrate external dashboards, tools, or custom web applications directly into the MoveIt Pro interface. See Creating Custom View Panes for details.